
Ready to talk?
Ready to talk?
4
spots left for Q2
4
4
spots left for Q2
spots left for Q2


Growth Blueprint
Pouring $10K/Month Into Ads
But Your Store Still Won’t Convert?
Stop pouring ad budget into a leaky bucket. Get the forensic audit that finds
exactly what's broken in your e-commerce store and the roadmap to fix it.
3-tier deep dive: UX, Code & Functionality
Prioritized fixes ranked by revenue impact
Includes $2,000 implementation credit
Best for
Trusted by 50+ tech market leaders
Trusted by 50+ tech market leaders
The "Leaky Bucket" Reality
The "Leaky Bucket" Reality
Most e-commerce brands think growth comes from more traffic. But if your store has conversion friction, you’re paying a tax on every single visitor.
Most e-commerce brands think growth comes from more traffic. But if your store has conversion friction, you’re paying a tax on every single visitor.
Most e-commerce brands think growth comes from more traffic.
But if your store has conversion friction, you’re paying a tax on every single visitor.
The Problem - Your Store Is Bleeding Revenue
The Problem - Your Store Is Bleeding Revenue
The average e commerce store loses 35% of potential sales due to:

Poor mobile UX

Hidden checkout bugs

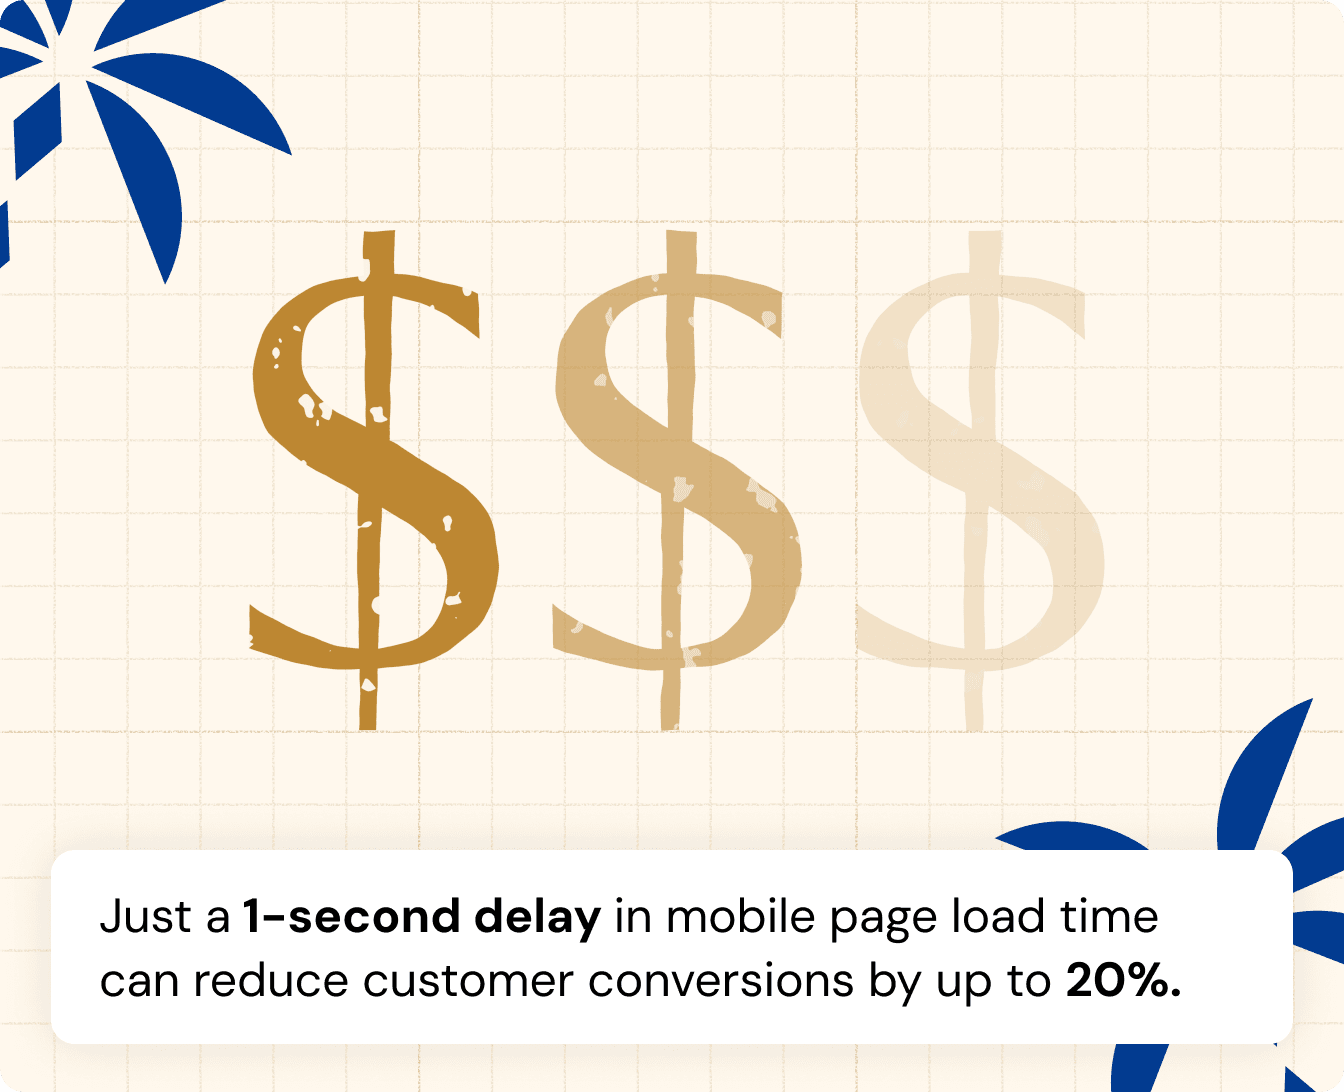
Slow load times
The worst part? Spending more on marketing only increases the volume of revenue you leak.

The Growth Blueprint Effect
The Growth Blueprint Effect
The Growth Blueprint Effect
Current Website
Current Website
50,000 Visitors at 1.5% CR = 750 Orders
50,000 Visitors at 1.5% CR = 750 Orders
50,000 Visitors at 1.5% CR = 750 Orders
With Blueprint
With Blueprint

$121,250
Revenue
50,000 Visitors at 1.8% CR = 900 Orders
50,000 Visitors at 1.8% CR = 900 Orders
50,000 Visitors at 1.8% CR = 900 Orders
That 0.3% conversion lift translates to $20,250 in extra revenue every single month from the traffic you already have. That’s over $243,000 in annualized revenue, without spending a penny more on ads.
That 0.3% conversion lift translates to $20,250 in extra revenue every single month from the traffic you already have. That’s over $243,000 in annualized revenue, without spending a penny more on ads.
We Don't Use Robots.
We Use Revenue-Focused Experts.
We Don't Use Robots.
We Use Revenue-Focused Experts.
We Don't Use Robots.
We Use Revenue-Focused Experts.
Other agencies run generic software scans that flood your dev team
with low-priority tickets. We eliminate the guesswork.
Other agencies run generic software scans that flood your dev team with low-priority tickets. We eliminate the guesswork.
Other agencies run generic software scans that flood your dev team with low-priority tickets. We eliminate the guesswork.
Clear priority roadmap
Clear priority roadmap
ROI based decisions
ROI based decisions
Pays for itself in revenue lift
Pays for itself in revenue lift
Finds real purchase issues
Finds real purchase issues
Tests real user behavior
Tests real user behavior
Focused on revenue, not vanity metrics
Focused on revenue, not vanity metrics

Growth
Blueprint
Growth
Blueprint
Generic "Audit" Tools
Generic "Audit" Tools
The 3 Pillars of the Growth Blueprint
The 3 Pillars of the Growth Blueprint
The 3 Pillars of the Growth Blueprint
E-commerce is complex. Fixing site speed can break your checkout. Improving UX can introduce new bugs. True profitable growth demands a 360° assessment, not isolated quick fixes.
E-commerce is complex. Fixing site speed can break your checkout. Improving UX can introduce new bugs. True profitable growth demands a 360° assessment, not isolated quick fixes.

Conversion Friction Analysis
Conversion Friction Analysis
We diagnose the psychological and design blockers that silently push users away from purchase. The goal is to make the decision to buy feel effortless.
We diagnose the psychological and design blockers that silently push users away from purchase. The goal is to make the decision to buy feel effortless.
Navigation
Navigation
Clarity
Clarity
Hierarchy
Hierarchy
Mobile Flow
Mobile Flow
Visual Integrity
Visual Integrity

Purchase Pathway Stress Test
Purchase Pathway Stress Test
We proactively try to break your store on real devices across browsers, payment methods, and edge cases— before your customers do. The goal is zero hidden technical friction.
We proactively try to break your store on real devices across browsers, payment methods, and edge cases— before your customers do. The goal is zero hidden technical friction.
Cross-Device QA
Cross-Device QA
Logic Blockers
Logic Blockers
Stress-testing
Stress-testing
Case Scenarios
Case Scenarios

Technical Velocity Review
Technical Velocity Review
We make sure your codebase is a foundation for growth, not a bottleneck. We maximize speed and stability for higher organic rankings and lower CPA.
We make sure your codebase is a foundation for growth, not a bottleneck. We maximize speed and stability for higher organic rankings and lower CPA.
Platform Efficiency
Platform Efficiency
Code Bloat Removal
Code Bloat Removal
Code Bloat
Core Web Vitals
Core Web Vitals
Reviewing theme
Reviewing theme
How does the Blueprint process work?
How does the Blueprint process work?
How does the Blueprint process work?
Cart Errors
Cart Errors
Cart Errors
Payment Gateway Failures
Payment Gateway Failures
Payment Gateway Failures
Real Devices Check
Real Devices Check
Real Devices Check
‘Bug Hunter' report
‘Bug Hunter' report
‘Bug Hunter' report
Code bloat
Code bloat
Code bloat
Page Speed Analysis
Page Speed Analysis
Page Speed Analysis
Accessibility
Accessibility
Accessibility
A Technical Roadmap
A Technical Roadmap
A Technical Roadmap
Setup
Setup
Setup
UX & CRO Analysis
UX & CRO Analysis
UX & CRO Analysis
Prioritized list of UX/CRO improvements
Prioritized list of UX/CRO improvements
Prioritized list of UX/CRO improvements
Week 1
Conversion Analysis
The "User Journey" Audit. Our Senior CRO/UX Designer analyzes the psychology of your layout. We don't just look for "ugly", we look for "confusing."
Week 2
Pathway Stress Test
The "Functionality" Audit. If a user can't buy, you don't grow. Our QA team manually tests the "edge cases" that break sales.
Week 3
Technical Velocity Review
The "Performance" Audit. Speed is a feature. Google ranks faster sites higher, and users buy more from them.
Week 4
Handoff & Application
The "User Journey" Audit. Our Senior CRO/UX Designer analyzes the psychology of your layout. We don't just look for "ugly", we look for "confusing."
Is This Right for You?
Is This Right for You?
The Growth Blueprint works best for:
E-commerce or DTC brands
doing $50K+/month in revenue
Brands with rising traffic but
flat or declining revenue
Teams spending $5K+ per month
on ads with conversion below 2%
E-commerce Stores
with 20K+ monthly visitors
Stores with
20K+ monthly visitors
Don’t like the forms? Drop us a line via email.

TAKUTAKU © 2026. All rights reserved.
Don’t like the forms? Drop us a line via email.
TAKUTAKU © 2026. All rights reserved.
Ready to talk?
4
spots left for Q2
4
spots left for Q2
Growth Blueprint
Pouring $10K/Month Into Ads
But Your Store Still Won’t Convert?
A forensic, 3-tier deep dive into your UX, Code, and Functionality. We find the hidden friction points costing you revenue and give you the roadmap to fix them.
A forensic, 3-tier deep dive into your UX, Code, and Functionality.
Prioritized fixes ranked by revenue impact
Includes $2,000 implementation credit
Best for
Trusted by 50+ tech market leaders
The "Leaky Bucket" Reality
Most brands think growth comes from more traffic. But if your store has technical friction, you are paying a "tax" on every single visitor.
The Problem - Your Store Is Bleeding Revenue
The average e commerce store loses 35% of potential sales due to:
Poor mobile UX
Hidden checkout bugs
Slow load times
The worst part? Spending more on marketing only increases the volume of revenue you leak.
The Growth
Blueprint Effect
Current Website
50,000 Visitors
at 1.5% CR = 750 Orders
With Blueprint
$121,250
Revenue
50,000 Visitors
at 1.8% CR = 900 Orders
That 0.3% conversion lift translates to $20,250 in extra revenue every single month from the traffic you already have. That’s over $243,000 in annualized revenue, without spending a penny more on ads.
We Don't Use Robots.
We Use Experts Who Understand Revenue.
Other agencies run generic software scans that flood your dev team with low-priority tickets. We eliminate the guesswork.
Clear priority
roadmap
ROI based
decisions
Pays back
its own cost
Finds real
purchase issues
Tests real
user behavior
Focused on
revenue impact
Growth
Blueprint
Generic "Audit" Tools
The 3 Pillars of
the Growth Blueprint
E-commerce is complex. Fixing site speed can break your checkout. Improving UX can introduce new bugs. True profitable growth demands a 360° assessment, not isolated quick fixes.
Conversion Friction Analysis
We diagnose the psychological and design blockers that silently push users away from purchase. The goal is to make the decision to buy feel effortless.
Navigation
Clarity
Hierarchy
Mobile Flow
Visual Integrity
Purchase Pathway Stress Test
We proactively try to break your store on real devices across browsers, payment methods, and edge cases— before your customers do. The goal is zero hidden technical friction.
Cross-Device QA
Logic Blockers
Stress-testing
Case Scenarios
Technical Velocity Review
We make sure your codebase is a foundation for growth, not a bottleneck. We maximize speed and stability for higher organic rankings and lower CPA.
Platform Efficiency
Code Bloat Removal
Core Web Vitals
Reviewing theme
How does the Blueprint work?
Cart Errors
Payment Gateway Failures
Real Devices Check
‘Bug Hunter' report
Code bloat
Page Speed Analysis
Accessibility
A Technical Roadmap
Setup
UX & CRO Analysis
Prioritized list of UX/CRO improvements
Week 1
Conversion Analysis
The "User Journey" Audit. Our Senior CRO/UX Designer analyzes the psychology of your layout. We don't just look for "ugly", we look for "confusing."
Week 2
Pathway Stress Test
The "Functionality" Audit. If a user can't buy, you don't grow. Our QA team manually tests the "edge cases" that break sales.
Week 3
Technical Velocity Review
The "Performance" Audit. Speed is a feature. Google ranks faster sites higher, and users buy more from them.
Week 4
Handoff & Application
The "User Journey" Audit. Our Senior CRO/UX Designer analyzes the psychology of your layout. We don't just look for "ugly", we look for "confusing."
Is This Right for You?
The Growth Blueprint works best for:
E-commerce or DTC brands doing $50K+/month in revenue
Brands with rising traffic but flat or declining revenue
Teams spending $5K+ per month on ads with conversion below 2%
E-commerce Stores with 20K+ monthly visitors
Don’t like the forms? Drop us a line via email.
TAKUTAKU © 2026. All rights reserved.
Ready to talk?
4
spots left for Q2
4
spots left for Q2
Growth Blueprint
Pouring $10K/Month Into Ads
But Your Store Still Won’t Convert?
Stop pouring ad budget into a leaky bucket. Get the forensic audit that finds
exactly what's broken in your e-commerce store and the roadmap to fix it.
3-tier deep dive: UX, Code & Functionality
Prioritized fixes ranked by revenue impact
Includes $2,000 implementation credit
Best for
Trusted by 50+ tech market leaders
The "Leaky Bucket" Reality
Most e-commerce brands think growth comes from more traffic.
But if your store has conversion friction, you’re paying a tax on every single visitor.
The Problem - Your Store Is Bleeding Revenue
The average e commerce store loses 35% of potential sales due to:
Poor mobile UX
Hidden checkout bugs
Slow load times
The worst part? Spending more on marketing only increases the volume of revenue you leak.
The Growth Blueprint Effect
Current Website
50,000 Visitors at 1.5% CR = 750 Orders
With Blueprint
$121,250
Revenue
50,000 Visitors at 1.8% CR = 900 Orders
That 0.3% conversion lift translates to $20,250 in extra revenue every single month from the traffic you already have. That’s over $243,000 in annualized revenue, without spending a penny more on ads.
We Don't Use Robots.
We Use Revenue-Focused Experts.
Other agencies run generic software scans that flood your dev team
with low-priority tickets. We eliminate the guesswork.
Clear priority roadmap
ROI based decisions
Pays for itself in revenue lift
Finds real purchase issues
Tests real user behavior
Focused on revenue, not vanity metrics
Growth
Blueprint
Generic "Audit" Tools
The 3 Pillars of the Growth Blueprint
E-commerce is complex. Fixing site speed can break your checkout. Improving UX can introduce new bugs.
True profitable growth demands a 360° assessment, not isolated quick fixes.
Conversion Friction Analysis
We diagnose the psychological and design blockers that silently push users away from purchase. The goal is to make the decision to buy feel effortless.
Navigation
Clarity
Hierarchy
Mobile Flow
Visual Integrity
Purchase Pathway Stress Test
We proactively try to break your store on real devices across browsers, payment methods, and edge cases— before your customers do. The goal is zero hidden technical friction.
Cross-Device QA
Logic Blockers
Stress-testing
Case Scenarios
Technical Velocity Review
We make sure your codebase is a foundation for growth, not a bottleneck. We maximize speed and stability for higher organic rankings and lower CPA.
Platform Efficiency
Code Bloat Removal
Core Web Vitals
Reviewing theme
How does the Blueprint process work?
Cart Errors
Payment Gateway Failures
Real Devices Check
‘Bug Hunter' report
Code bloat
Page Speed Analysis
Accessibility
A Technical Roadmap
Setup
UX & CRO Analysis
Prioritized list of UX/CRO improvements
Week 1
Conversion Analysis
The "User Journey" Audit. Our Senior CRO/UX Designer analyzes the psychology of your layout. We don't just look for "ugly", we look for "confusing."
Week 2
Pathway Stress Test
The "Functionality" Audit. If a user can't buy, you don't grow. Our QA team manually tests the "edge cases" that break sales.
Week 3
Technical Velocity Review
The "Performance" Audit. Speed is a feature. Google ranks faster sites higher, and users buy more from them.
Week 4
Handoff & Application
The "User Journey" Audit. Our Senior CRO/UX Designer analyzes the psychology of your layout. We don't just look for "ugly", we look for "confusing."
Is This Right for You?
The Growth Blueprint works best for:
E-commerce or DTC brands
doing $50K+/month in revenue
Brands with rising traffic but
flat or declining revenue
Teams spending $5K+ per month
on ads with conversion below 2%
E-commerce Stores
with 20K+ monthly visitors
Don’t like the forms? Drop us a line via email.
TAKUTAKU © 2026. All rights reserved.
Ready to talk?
4
spots left for Q2
4
spots left for Q2

Growth Blueprint
Pouring $10K/Month Into Ads
But Your Store Still Won’t Convert?
Stop pouring ad budget into a leaky bucket. Get the forensic audit that finds
exactly what's broken in your e-commerce store and the roadmap to fix it.
3-tier deep dive: UX, Code & Functionality
Prioritized fixes ranked by revenue impact
Includes $2,000 implementation credit
Best for
Trusted by 50+ tech market leaders
The "Leaky Bucket" Reality
Most e-commerce brands think growth comes from more traffic. But if your store has conversion friction, you’re paying a tax on every single visitor.
The Problem - Your Store Is Bleeding Revenue
The average e commerce store loses 35% of potential sales due to:
Poor mobile UX
Hidden checkout bugs
Slow load times
The worst part? Spending more on marketing only increases the volume of revenue you leak.
The Growth Blueprint Effect
Current Website
50,000 Visitors at
1.5% CR = 750 Orders
With Blueprint
$121,250
Revenue
50,000 Visitors at
1.8% CR = 900 Orders
That $0.3% lift translates to $20,250 in extra revenue every single month—all from your existing traffic. That’s over $243,000 in annualized revenue secured without spending a penny more on ads. That is the financial leverage of the Growth Blueprint.
We Don't Use Robots.
We Use Revenue-Focused Experts.
Other agencies run generic software scans that flood your dev team
with low-priority tickets. We eliminate the guesswork.
Clear priority roadmap
ROI based decisions
Pays for itself in revenue lift
Finds real purchase issues
Tests real user behavior
Focused on revenue, not vanity metrics
Growth
Blueprint
Generic "Audit" Tools
The 3 Pillars of the Growth Blueprint
E-commerce is complex. Fixing site speed can break your checkout. Improving UX can introduce new bugs. True profitable growth demands a 360° assessment, not isolated quick fixes.
Conversion Friction Analysis
We diagnose the psychological and design blockers that silently push users away from purchase. The goal is to make the decision to buy feel effortless.
Navigation
Clarity
Hierarchy
Mobile Flow
Visual Integrity
Purchase Pathway Stress Test
We proactively try to break your store on real devices across browsers, payment methods, and edge cases— before your customers do. The goal is zero hidden technical friction.
Cross-Device QA
Logic Blockers
Stress-testing
Case Scenarios
Technical Velocity Review
We make sure your codebase is a foundation for growth, not a bottleneck. We maximize speed and stability for higher organic rankings and lower CPA.
Platform Efficiency
Code Bloat Removal
Core Web Vitals
Reviewing theme
How does the Blueprint process work?
Cart Errors
Payment Gateway Failures
Real Devices Check
‘Bug Hunter' report
Code bloat
Page Speed Analysis
Accessibility
A Technical Roadmap
Setup
UX & CRO Analysis
Prioritized list of UX/CRO improvements
Week 1
Conversion Analysis
The "User Journey" Audit. Our Senior CRO/UX Designer analyzes the psychology of your layout. We don't just look for "ugly", we look for "confusing."
Week 2
Pathway Stress Test
The "Functionality" Audit. If a user can't buy, you don't grow. Our QA team manually tests the "edge cases" that break sales.
Week 3
Technical Review
The "Performance" Audit. Speed is a feature. Google ranks faster sites higher, and users buy more from them.
Week 4
Handoff
The "User Journey" Audit. Our Senior CRO/UX Designer analyzes the psychology of your layout. We don't just look for "ugly", we look for "confusing."
Is This Right for You?
The Growth Blueprint works best for:
DTC brands doing
$50K+/month in revenue
Brands with rising traffic but
flat or declining revenue
Teams spending $5K+ per month
on ads with conversion below 2%
E-commerce Stores
with 20K+ monthly visitors
Don’t like the forms? Drop us a line via email.
TAKUTAKU © 2026. All rights reserved.
Ready to talk?
4
spots left for Q2
4
spots left for Q2
Growth Blueprint
Pouring $10K/Month Into Ads
But Your Store Still Won’t Convert?
Stop pouring ad budget into a leaky bucket. Get the forensic audit that finds
exactly what's broken in your e-commerce store and the roadmap to fix it.
3-tier deep dive: UX, Code & Functionality
Prioritized fixes ranked by revenue impact
Includes $2,000 implementation credit
Best for
Trusted by 50+ tech market leaders
The "Leaky Bucket" Reality
Most e-commerce brands think growth comes from more traffic.
But if your store has conversion friction, you’re paying a tax on every single visitor.
The Problem - Your Store Is Bleeding Revenue
The average e commerce store loses 35% of potential sales due to:
Poor mobile UX
Hidden checkout bugs
Slow load times
The worst part? Spending more on marketing only increases the volume of revenue you leak.
The Growth Blueprint Effect
Current Website
50,000 Visitors at 1.5% CR = 750 Orders
With Blueprint
$121,250
Revenue
50,000 Visitors at 1.8% CR = 900 Orders
That 0.3% conversion lift translates to $20,250 in extra revenue every single month from the traffic you already have. That’s over $243,000 in annualized revenue, without spending a penny more on ads.
We Don't Use Robots.
We Use Revenue-Focused Experts.
Other agencies run generic software scans that flood your dev team
with low-priority tickets. We eliminate the guesswork.
Clear priority roadmap
ROI based decisions
Pays for itself in revenue lift
Finds real purchase issues
Tests real user behavior
Focused on revenue, not vanity metrics
Growth
Blueprint
Generic "Audit" Tools
The 3 Pillars of the Growth Blueprint
E-commerce is complex. Fixing site speed can break your checkout. Improving UX can introduce new bugs. True profitable growth demands a 360° assessment, not isolated quick fixes.
Conversion Friction Analysis
We diagnose the psychological and design blockers that silently push users away from purchase. The goal is to make the decision to buy feel effortless.
Navigation
Clarity
Hierarchy
Mobile Flow
Visual Integrity
Purchase Pathway Stress Test
We proactively try to break your store on real devices across browsers, payment methods, and edge cases— before your customers do. The goal is zero hidden technical friction.
Cross-Device QA
Logic Blockers
Stress-testing
Case Scenarios
Technical Velocity Review
We make sure your codebase is a foundation for growth, not a bottleneck. We maximize speed and stability for higher organic rankings and lower CPA.
Platform Efficiency
Code Bloat Removal
Core Web Vitals
Reviewing theme
How does the Blueprint process work?
Cart Errors
Payment Gateway Failures
Real Devices Check
‘Bug Hunter' report
Code bloat
Page Speed Analysis
Accessibility
A Technical Roadmap
Setup
UX & CRO Analysis
Prioritized list of UX/CRO improvements
Week 1
Conversion Analysis
The "User Journey" Audit. Our Senior CRO/UX Designer analyzes the psychology of your layout. We don't just look for "ugly", we look for "confusing."
Week 2
Pathway Stress Test
The "Functionality" Audit. If a user can't buy, you don't grow. Our QA team manually tests the "edge cases" that break sales.
Week 3
Technical Velocity Review
The "Performance" Audit. Speed is a feature. Google ranks faster sites higher, and users buy more from them.
Week 4
Handoff & Application
The "User Journey" Audit. Our Senior CRO/UX Designer analyzes the psychology of your layout. We don't just look for "ugly", we look for "confusing."
Is This Right for You?
The Growth Blueprint works best for:
E-commerce or DTC brands doing
$50K+/month in revenue
Brands with rising traffic
but flat or declining revenue
Teams spending $5K+ per month
on ads with conversion below 2%
E-commerce Stores
with 20K+ monthly visitors
Don’t like the forms? Drop us a line via email.
TAKUTAKU © 2026. All rights reserved.